A guided tour of the operator console
Read this before the spec. It explains why we are changing the surface, who it serves, and how to read it. The brief that follows is a build plan. This page is the argument behind the build plan.
1. Why we are changing it #
The current screen — the one Artem demoed — is a great market viewer. It plots our model probability against the market mid, lets you filter by strategy, and shows the day's fills. The chart, the filter, the status workflow — these are the hardest part of this problem and they are already shipped. None of the change below questions that.
What we are proposing is a change in what the screen is for:
Today — a viewer of bot signals
- The chart is the page
- Fills are annotations on a line
- Strategies are a filter
- The decision behind a fill lives on a separate page
- Risk and latency are pages you remember to check
Next — a console that supervises bots
- The chart is the centre of a console
- Fills are first-class glyphs you click
- Strategies are a leaderboard with live P&L
- The decision is a drawer beside the fill
- Risk and latency are always visible
The distinction matters because we are not following markets — we are monitoring bots. A market viewer answers "what is the market doing?". We do not need that question answered any more, because we already know what the market is doing. The bots tell us. What we need answered is the next layer up:
A market viewer makes you scroll, click, and switch tabs to answer that question. A bot console answers it in the layout itself — before you click anything.
2. Three audiences, one screen #
The reason the screen has the shape it does is that it serves three different people at once. Each of them sits down with a different question. The layout has to answer all three without making any of them dig.
The operator
Sits with the screen open while bots are live. Asks: "Is anything broken right now, and are we within limits?" Wants the answer in seconds — P&L, position, latency, kill switch — in one glance.
The quant
Opens a fill from yesterday and asks: "Why did the bot trade here, and was it right to?" Wants model probability vs market, captured edge, top features that moved the model, and a counterfactual P&L beside the fill itself.
Risk and management
Glances once a day. Asks: "Are we exposed to anything I should know about?" Wants position cap usage, Kelly fraction, drawdown headroom, market liquidity, and the kill switch visible from the home screen.
One screen, three jobs. The Bloomberg terminal has the same shape because it solves the same problem: market identity at the top, a watch-list on one side, a price action surface in the middle, a context drawer on the other side, status strip along the bottom. The reason that layout has survived four decades is that watch many, drill into one is the right shape for the job. We are borrowing the shape because the job is the same shape.
3. Clarity — what we mean by it #
Clarity on this screen is not a visual preference. It is an operational requirement, and it has four parts:
- Where the eye lands first is what matters most. Today's P&L sits top-right, because if it is red you stop and investigate before doing anything else. KILL ALL is the only red button on the page, always in the same place. The market identity line is the second most prominent element. Everything else is calmer on purpose.
- One question, one region. Each region of the screen answers a single operator question. "What is happening today?" is the top strip. "Who is trading?" is the leaderboard. "Why did this fill happen?" is the drawer. "Is the plumbing healthy?" is the bottom strip. No region answers two questions, no question is split across two regions.
- The data answers itself. If a fill was good, the glyph is bright green. If it was bad, it is red. If latency is healthy, the bar is green; if it is stressed, it is amber; if it is broken, it is red. Operators should not have to read numbers to know whether something is OK. Numbers are for when an operator wants to know by how much.
- Drilling is one click, never two. Click a fill, the drawer fills with the decision. Click a strategy, the chart isolates its fills. Click the latency bar, the microstructure pane expands. Nothing important is two clicks away from the home screen.
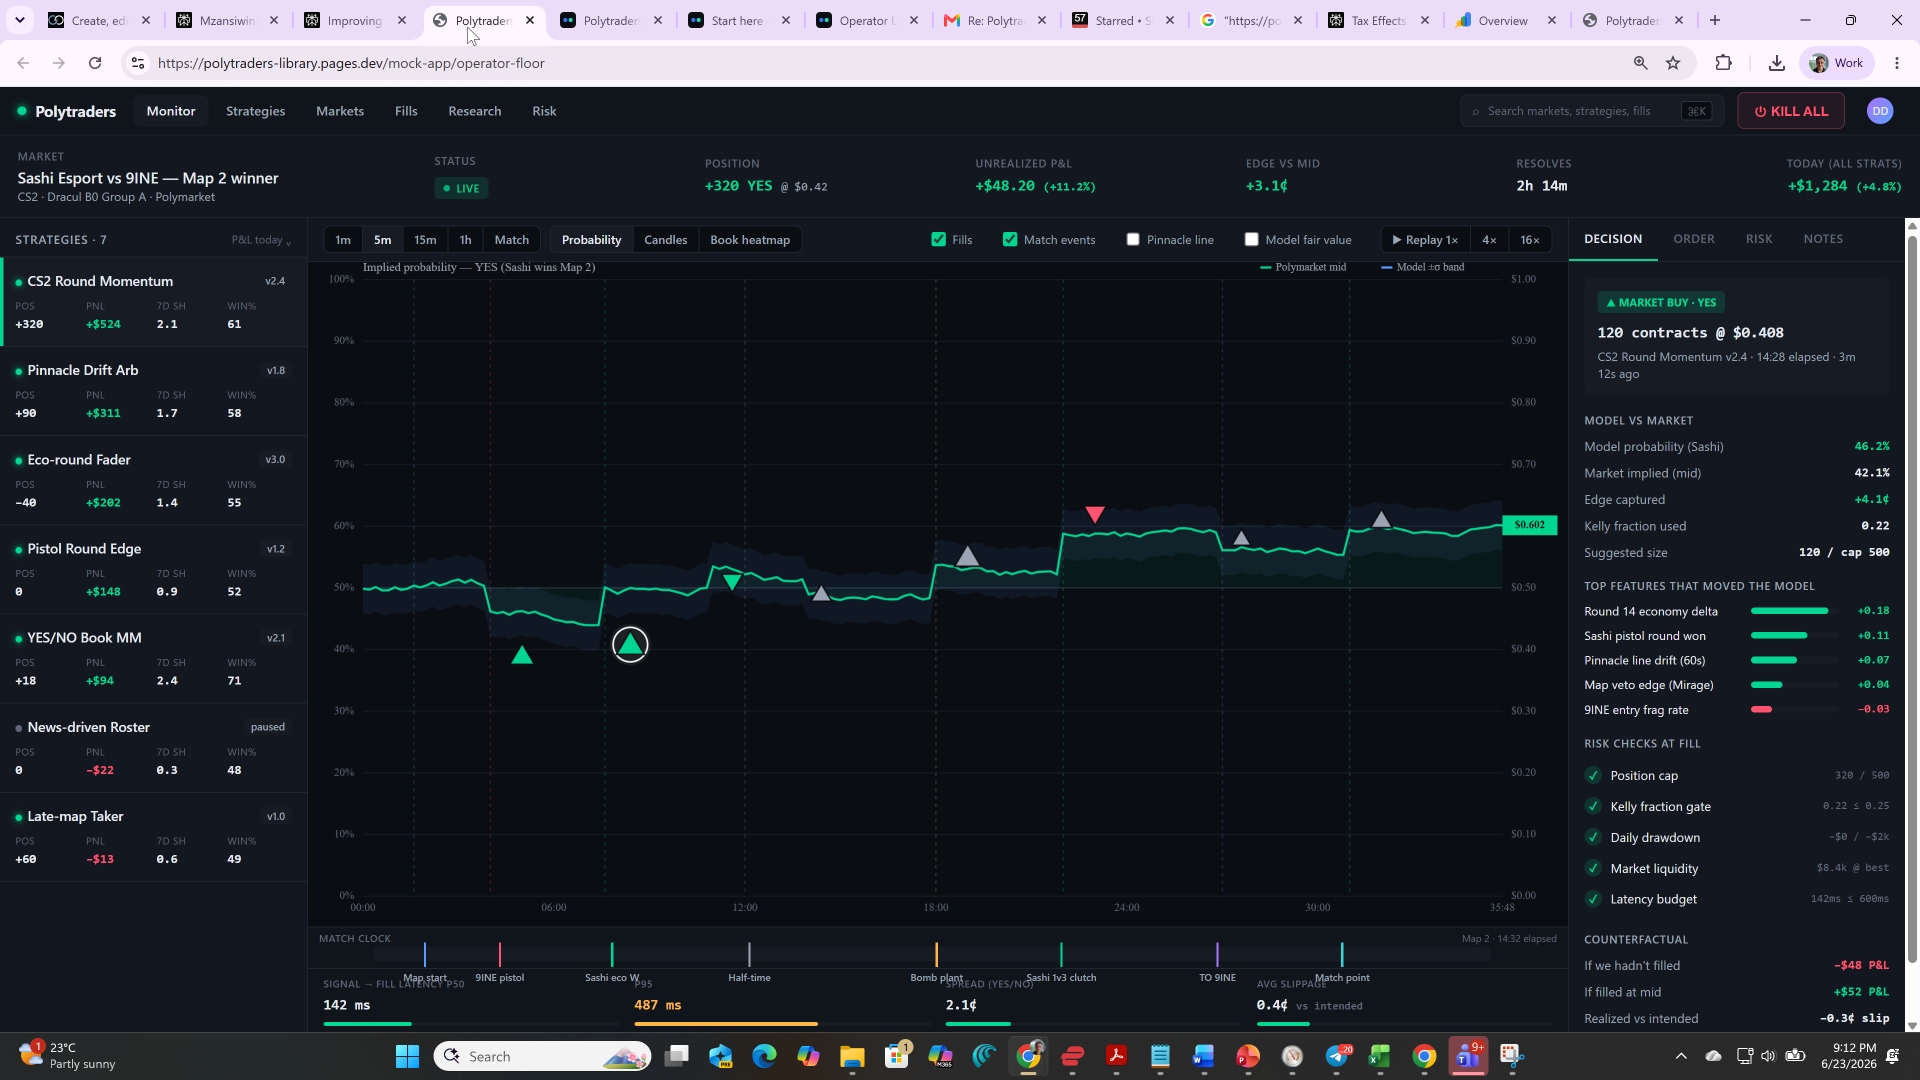
4. The screenshot, region by region #
This is the live operator floor as we have it today — a CS2 esports market on Polymarket (Sashi Esport vs 9INE, Map 2 winner), with our bots live on it. The pins on the image correspond to the numbered descriptions below.
 1
2
3
4
5
6
7
1
2
3
4
5
6
7
5. How to read the screen in 30 seconds #
- Top right. Today's P&L. Green or red? If red, stop reading and find out why.
- Top left. Which market, our position, edge versus mid. Is the edge positive? Is the position within cap?
- Bottom strip. Latency green? Spread reasonable? If anything is amber, the plumbing is stressed.
- Centre chart. Are fills clustered around inflection points (good) or smeared randomly (worth a closer look)?
- Left rail. Which strategies are carrying today? Anything paused or degraded?
- Right rail (only if needed). Click a fill to see the decision behind it. Most of the time you don't need this — only when something looks wrong.
A senior operator should be able to do this loop in roughly 30 seconds and form a clear mental model of the day before doing anything else.
6. What we are asking from the team #
Read the full operator UX brief end to end — it has the data model, the three build phases, and the one-sprint scope. Then open the live demo and click around. Bring back what feels wrong, missing, or over-built. We adjust before we ship.
To be very clear: the foundation Artem demoed — the chart, the TradingView-style overlay on Polymarket, the strategy filtering, the date filtering, the status workflow — is doing the hardest part of this problem already. The data model is clearly there, which is the part that actually takes time. This page is a build-on, not a rewrite. The work ahead is the kind of work this team is good at — small, sharp, daily — not a ground-up rebuild.